
Preparation Manual
![]()
Section 7: Sample Selected-Response Questions
TX PACT: Essential Academic Skills Subtest III: Mathematics (703)
Expand All Answers | Collapse All Answers
This section presents some sample exam questions for you to review as part of your preparation for the exam. To demonstrate how each competency may be assessed, sample questions are accompanied by the competency that they measure. While studying, you may wish to read the competency before and after you consider each sample question. Please note that the competency statements do not appear on the actual exam.
The correct answer is provided for each sample exam question. The sample questions are included to illustrate the formats and types of questions you will see on the exam; however, your performance on the sample questions should not be viewed as a predictor of your performance on the actual exam.
Competency 001—Understand number properties and number operations.
1. The budget for a school district increased from 25.0 million dollars to 26.3 million dollars in one year. What was the percentage increase in the budget?
- 1.5%
- 4.9%
- 5.2%
- 13%
- Enter to expand or collapse answer.Answer expanded
- Option C is correct. This question requires the examinee to solve word problems involving percents. A change from 25.0 million dollars to 26.3 million dollars represents an increase of 1.3 million dollars (26.3 minus 25.0 equals 1.3). To find the percentage increase, divide 1.3 by 25.0 to get the decimal 0.052. Multiply the decimal result by 100 to convert it to a percentage (0.052 times 100 equals 5.2%).
Competency 002—Understand fundamental principles of algebra.
2.
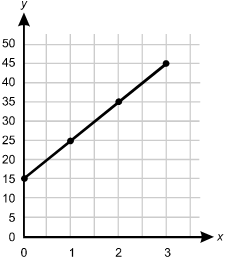
Axis X has values marked from 0 to 3 in increments of 1 marked at every 2nd grid line. Axis Y has values marked from 0 to 50 in increments of 5 marked at each grid line. The line has data points at (0, 15); (1, 25); (2, 35); and (3, 45).
The graph above shows the results of an experiment. Which of the following equations represents the graph?- y equals x plus 10
- y equals x plus 15
- y equals 10x plus 15
- y equals 15x plus 10
- Enter to expand or collapse answer.Answer expanded
- Option C is correct. This question requires the examinee to identify the linear equation that best represents data presented in graph form. The equation that represents a linear graph can be identified by using the equation y equals mx plus b where m represents the slope of the line, and b represents the line's y-intercept. The slope of the line is the line's rise over the line's run and can be calculated using any two points on the line. Using the points (0, 15) and (1, 25), the rise can be found by subtracting 15 from 25 to get 10. The run can be found by subtracting 0 from 1 to get 1. The slope is therefore 10 over 1 or 10. The y-intercept is the y-coordinate of the point at which the line crosses the y-axis, which in the case of the given graph is 15. For the given line, the equation y equals mx plus b can be rewritten y equals 10x plus 15.
Competency 003—Understand measurement principles and geometry concepts.
3. It took a person 35 minutes to fix a problem on 6 computer workstations. If this person works at the same rate, how long will it take to fix the same problem on an additional 24 computers?
- 1 hour and 40 minutes
- 2 hours and 20 minutes
- 2 hours and 33 minutes
- 4 hours and 4 minutes
- Enter to expand or collapse answer.Answer expanded
- Option B is correct. This question requires the examinee to convert units within measurement systems. It takes 35 minutes to fix a problem on 6 workstations. To fix 24 workstations, 4 times as many, it must take 4 times as long, or 35 times 4 equals 140 minutes. Two hours is 120 minutes, therefore 140 minutes must be 2 hours and 20 minutes.
Competency 004—Understand probability and statistics.
4. Summary data on the scores of four weekly quizzes are given below. Which week's quiz has the greatest spread in scores?
- Week 1: mean test score equals 82%,
standard deviation equals 12 points - Week 2: mean test score equals 78%,
standard deviation equals 14 points - Week 3: mean test score equals 72%,
standard deviation equals 10 points - Week 4: mean test score equals 61%,
standard deviation equals 9 points
- Enter to expand or collapse answer.Answer expanded
- Option B is correct. This question requires the examinee to demonstrate knowledge of the concept of spread. Standard deviation is a measure of the spread of data from the mean. Of the four choices, choice B has the greatest standard deviation and therefore the greatest spread.
Competency 005—Understand problem solving, reasoning, and mathematical communication.
5. The surface area of the earth is roughly 1.97 times 10 to the power of 8 square miles and the population of the earth is about 6.5 times 10 to the power of 9 people. Most of the earth's surface is water—only about 30% of the earth's surface is land. Given this information, which of the following is the best estimate of the average number of people per square mile of the earth's land surface?
- approximately 10
- approximately 30
- approximately 100
- approximately 300
- Enter to expand or collapse answer.Answer expanded
- Option C is correct. This question requires the examinee to estimate the solution to a given problem. To solve this problem, begin by rounding 1.97 to 2.0 and rounding 6.5 to 6.0. Since 30% of the earth's surface is land, an estimate of the number of square miles of land on the earth would be 30% of 2.0 times 10 to the power of 8 square miles or 0.6 times 10 to the power of 8 square miles. The number of people per square mile can be estimated by dividing 6.0 times 10 to the power of 9 people by 0.6 times 10 to the power of 8 square miles or the equivalent 6.0 times 10 to the power of 7 square miles. 6.0 times 10 to the power of 9 people divided by 6.0 times 10 to the power of 7 square miles is 100 people per square mile.
Return to Navigation